Analyze Your Twitter/X Account with OpenClaw: Beyond Basic Analytics
Use OpenClaw to run a qualitative analysis of your Twitter/X account. Discover what makes your posts go viral, what topics drive engagement, and how to improve.

Jean-Elie Lecuy
|Founder of ClawRapid
SaaS builder writing about OpenClaw, AI agents, and agentic coding, with one goal: make powerful tooling actually usable.
Twitter/X gives you an analytics dashboard. It shows you impressions, clicks, and engagement rate. Numbers go up, numbers go down. But it never tells you why.
Why did that thread get 1,200 likes while a similar one got 8? Why do your hot takes outperform your educational content 3:1? Why do you get more engagement on Tuesdays than Fridays?
The analytics tab shows you the what. OpenClaw shows you the why.
In this guide, we will set up OpenClaw to analyze your Twitter/X account qualitatively, identifying patterns, strengths, and weaknesses in your content strategy that no dashboard can surface.
What Qualitative Analysis Looks Like
A qualitative analysis goes beyond numbers. It examines:
- Content patterns: What topics, formats, and tones correlate with your best-performing posts
- Viral triggers: What specific elements (hooks, opinions, data, humor) make your posts spread
- Engagement gaps: Why some posts with great content underperform (timing, framing, length)
- Audience signals: What your followers actually respond to versus what you think they want
- Consistency analysis: How your posting frequency and quality vary over time
This is the kind of analysis that social media consultants charge $500+ for. OpenClaw does it in minutes, and you can run it as often as you want.
The Skill You Need
This setup uses the Bird skill, which comes pre-bundled with OpenClaw. No installation required.
Bird is a CLI tool that lets OpenClaw read your Twitter/X account data:
- Fetch your recent tweets (with engagement metrics)
- Search tweets by keyword or hashtag
- Access tweet details and thread structures
- Read replies and quote tweets
Setting Up Authentication
Bird requires your Twitter/X session cookies to access your account data. Here is how to set it up:
- Log into x.com in your browser (Chrome or Brave)
- Open Developer Tools (F12) and go to the Application tab
- Find two cookies under x.com:
auth_tokenct0
- Provide these to OpenClaw:
Here are my Twitter credentials for the Bird skill:
auth_token: [paste your auth_token]
ct0: [paste your ct0]

Store these securely and use them for all Twitter analysis tasks.
For security, we recommend creating a separate Twitter account for your OpenClaw bot rather than using your main account credentials. The analysis will still work since tweet data is public.
Running Your First Analysis
Basic Account Analysis
Start with a broad analysis to understand your overall performance:
Fetch my last 100 tweets from my Twitter account @YourHandle.
Analyze them and give me:

1. Top 5 best-performing tweets and what they have in common
2. Bottom 5 worst-performing tweets and what went wrong
3. Patterns in topics, formats, and tone that correlate with engagement
4. My optimal posting time based on engagement data
5. Specific recommendations to improve my content strategy
Content Category Breakdown
Understand which topics work best:
Look at my last 200 tweets and categorize them by topic
(tech, opinions, tutorials, personal, announcements, etc).

For each category, calculate:
- Average likes, retweets, and replies
- Engagement rate
- Best and worst performing examples

Show me which content categories I should double down on
and which ones I should reduce.
Thread Analysis
If you write threads, analyze their performance separately:
Find all my Twitter threads from the last 3 months.
For each thread:
- How many people started reading vs finished (engagement drop-off)
- Which individual tweets in the thread got the most engagement
- What hooks (first tweets) performed best

Give me a template for a high-performing thread based on my data.
Advanced Analysis Techniques
Viral Post Autopsy
When a post goes viral, understand exactly why:
My tweet [paste URL or ID] went viral with 5,000+ likes.
Analyze it deeply:

1. What was the hook? Why did people stop scrolling?
2. What emotional trigger did it hit?
3. What was the timing (day, time, news cycle context)?
4. What were the top replies and quote tweets?
5. Compare it to my other tweets about similar topics.
   What was different about this one?
Competitor Comparison
Compare your performance with accounts in your niche:
Compare my Twitter account @MyHandle with these accounts:
- @Competitor1
- @Competitor2
- @Competitor3

Fetch recent tweets from each. Compare:
- Content formats they use that I don't
- Topics they cover that I'm missing
- Posting frequency and timing differences
- Engagement patterns
- What I can learn from their best posts
Audience Analysis
Understand who engages with your content:
Look at the accounts that most frequently like, reply to,
and retweet my posts. Analyze:

1. Who are my top 20 most engaged followers?
2. What do they have in common (industry, interests, follower count)?
3. Are there patterns in who engages with which types of content?
4. Am I attracting the audience I want?
Automated Ongoing Analysis
Instead of running one-time analyses, set up recurring insights:
Weekly Performance Report
Every Sunday at 8pm, analyze my Twitter performance for the past week.
Send me a report with:

1. Top 3 best-performing posts and why
2. Any posts that underperformed expectations
3. Trends compared to the previous week
4. One specific actionable recommendation for next week
Post-Publish Feedback
Every time I publish a new tweet, check its performance after 4 hours.
If it's performing significantly above or below my average,
send me a quick note explaining why.
Monthly Strategy Review
On the 1st of every month, compile a full monthly review:
- Total impressions, engagement, and follower growth
- Content category performance trends
- What worked this month vs last month
- Updated content strategy recommendations
- Three specific post ideas for next month based on what performed best
Why OpenClaw Beats Paid Analytics Tools
There are dozens of Twitter analytics tools. Most cost $10-50/month. Here is why OpenClaw is different:
| Feature | Paid Tools (Typefully, etc.) | OpenClaw |
|---|---|---|
| Quantitative metrics | Yes | Yes |
| Qualitative analysis | Limited | Deep, AI-powered |
| Custom questions | No | Ask anything |
| Competitor analysis | Extra cost | Included |
| Content recommendations | Generic | Personalized to your data |
| Viral post autopsy | No | Yes |
| One-time cost | Monthly subscription | One server |
The biggest advantage: you can ask OpenClaw any question about your data. Paid tools give you pre-built dashboards. OpenClaw gives you a conversation with an AI that has read every single one of your tweets.
Real-World Use Cases
For Solopreneurs Building in Public
Track which build updates get engagement, which product announcements fall flat, and what your audience actually wants to hear about your journey.
For Content Creators
Identify your best content formats, optimize posting times, and develop a data-driven content calendar based on what your audience responds to.
For B2B Founders
Understand which thought leadership posts drive profile visits and website clicks. Connect Twitter engagement to actual business outcomes.
For Community Builders
Track which community-related posts drive the most replies and conversations. Optimize for engagement that builds relationships, not just vanity metrics.
How ClawRapid Makes This Easier
Running Twitter analysis with OpenClaw requires a configured server with the Bird skill. ClawRapid gives you everything pre-configured:
- Bird skill pre-installed: Just add your cookies and start analyzing
- Persistent analysis history: Your past analyses and preference data survive restarts
- Scheduled reports: Weekly and monthly reports run automatically
- Multi-channel delivery: Get reports on Telegram, Discord, or email
Deploy with ClawRapid in under 2 minutes and run your first Twitter analysis today.
Frequently Asked Questions
Is this safe? Will Twitter ban my account? Bird uses read-only access through session cookies. It does not automate posting, liking, or following. Read-only access is low-risk, but for extra safety, use a secondary account's cookies and analyze your main account's public tweets.
How far back can I analyze? Twitter's API and web interface limit how far back you can fetch tweets. Typically you can access the last 800-3,200 tweets depending on the method. For most users, this covers several months to a year of activity.
Can I analyze someone else's account? Yes, for public accounts. You can analyze any public Twitter account by fetching their recent tweets. This is useful for competitor analysis and learning from accounts in your niche.
Does this work with Twitter/X Premium analytics? OpenClaw works with publicly available tweet data. If you have Twitter Premium, you already have access to more detailed metrics. OpenClaw adds the qualitative layer on top, telling you why things perform the way they do.
How often should I run a full analysis? We recommend a weekly quick check and a monthly deep dive. Running analysis too frequently can lead to over-optimization. Give your content strategy changes at least 2-3 weeks to show results before adjusting again.
Can OpenClaw also write tweets for me? This guide focuses on analysis, but yes. Once OpenClaw understands your voice and what works, it can draft tweets that match your style and optimize for engagement. That is a separate use case worth exploring.
Get Started Today
Understanding your Twitter performance at a qualitative level is one of the most impactful OpenClaw use cases for anyone building a personal brand or business on X.
Stop guessing what works. Let OpenClaw analyze your data and tell you exactly where to focus. Check out our OpenClaw skills guide for more automation ideas, and deploy with ClawRapid to start your analysis in minutes.
Which agent do you want to deploy?
The battle-tested assistant, extensible with 16,000+ skills.
Which model do you want as default?
Very token efficient, moderate AI cost in practice. Free if you connect your ChatGPT Plus/Pro subscription.
You can switch anytime from your dashboard
Which channel do you want to use?
You can switch anytime from your dashboard
In 60 seconds, your AI agent is live.
Related articles
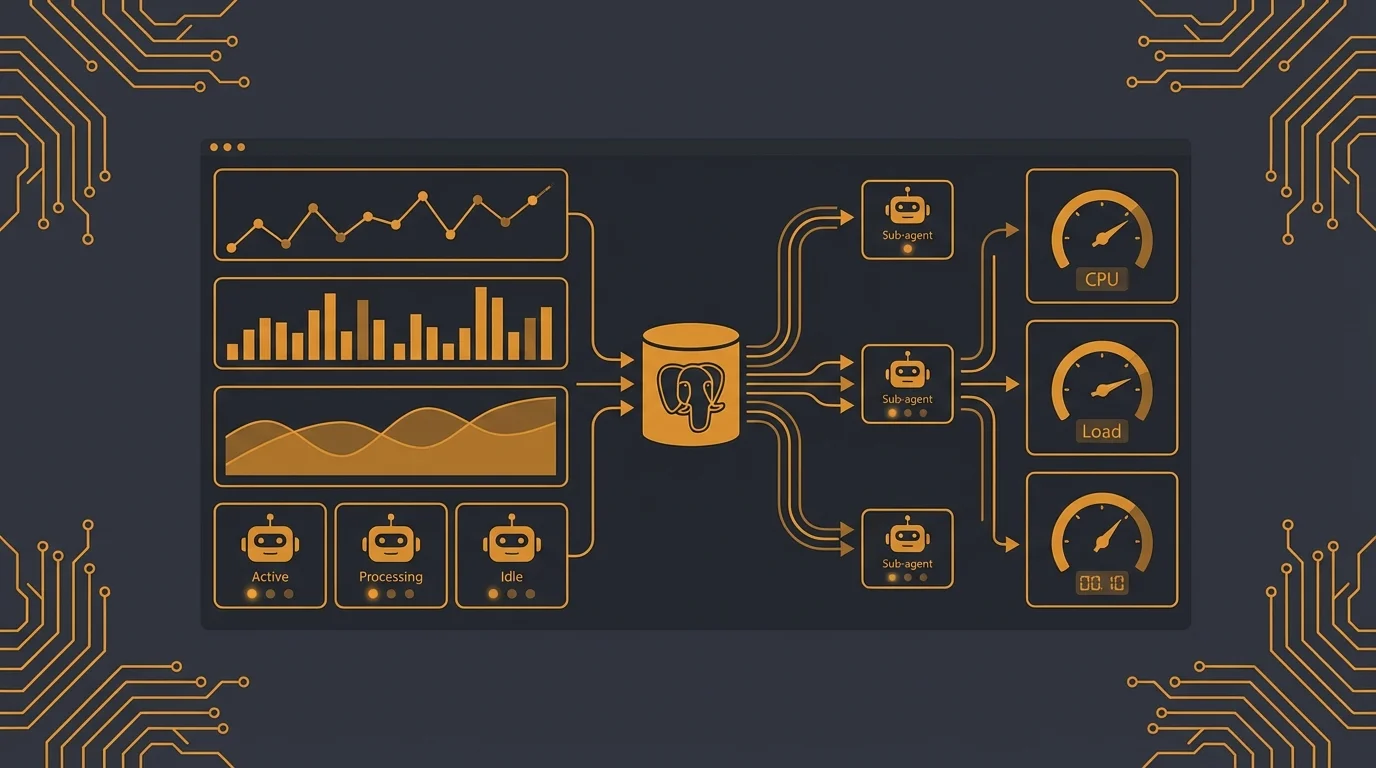
How to Build a Real-Time Dashboard with OpenClaw Sub-Agents and PostgreSQL
Build a dynamic monitoring dashboard with OpenClaw. Spawn parallel sub-agents to fetch GitHub, social, and system metrics, store history in PostgreSQL, and trigger alerts.

Track Tech Earnings with OpenClaw: Automated Alerts and AI Summaries
Build an AI-powered earnings tracker with OpenClaw. Get weekly previews, automated alerts on report day, and detailed summaries with beat/miss analysis.

OpenClaw Health Tracker: Track Nutrition and Symptoms to Find Your Triggers
Build a health and symptom tracker with OpenClaw: log meals via Telegram, get reminders, and run weekly analysis to identify possible triggers.